Track · Monitoring

Spot the fault before your listeners do

Servers, streams, sound-card outputs, folders and storage – set up once what to watch, and Track checks it all on schedule, day and night. The moment something drifts from normal, you know.

Monitoring console with a network map, green endpoints, storage bars and two nodes raising an alert

Sound familiar?

  • “A listener calls to say you’re off air – and that’s how you find out.
  • “You find out in the morning that the server disk filled up overnight.
  • “The news audio hasn’t been updated in days, and nobody noticed.

01

A dashboard and custom views, even for the wall screen

Every monitored item is a colour-coded tile: name, measured value, time of the last check. In the Designer you drag together views per studio or for the wall screen, with labels and groups.

  • Refreshes every minute on its own
  • Fewer tiles, labels readable across the room
  • Views as tabs, one click to switch
The Track dashboard with stream and sound-card tiles, two of them alerting

02

Alerts the moment something slips

When a reading crosses its threshold – response time climbs, the stream goes silent, space runs low – the tile turns red, the Events log records when the problem started and ended, and Telegram can tell you too.

  • Telegram message when an alert starts and clears
  • A grey tile when checks stop coming in
  • The reading at alert time stays in the log
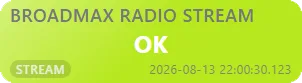
All good
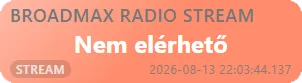
Alert: threshold exceeded
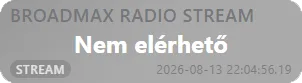
Stale: checks have stopped
  • Servers and network

    Ping with response time to any IP or hostname – even from a remote machine, so STL links and VPNs reachable from only one site are covered too.

  • Streams and sound cards

    Checks that a stream is reachable and actually carrying audio, and listens for silence on a sound-card input. Before alerting, it checks once more 30 seconds later.

  • Files, content and storage

    Watches whether a network folder is reachable, when the newest file arrived, when an asset last changed in your playout system, and how much space is left.

  • Tasks: every background job in view

    One table shows which scheduled tasks and exports ran, which got stuck and why. Rerun all the failed ones with a single click.

How it works

From setup to alert

  1. 1Add an object: what to watch and how
  2. 2Set the threshold and the schedule
  3. 3Checks run on schedule, no hands needed
  4. 4On a deviation: a red tile and an Events entry
  5. 5A Telegram message when it starts and when it clears

On watch even when nobody’s looking

Track measures day and night, and alerts reach your pocket via Telegram. The Dashboard opens in any browser, anywhere – no need to be at the station to see what’s going on.

What it can watch

  • Ping & response time
  • Shoutcast / Icecast streams
  • Sound-card silence
  • Folders & newest file
  • Free disk space
  • Custom SQL checks

Frequently asked questions

How does Track know we’ve gone silent?

For a stream it first checks the URL, then analyses a short audio sample; for a sound card it samples the input. If it hears silence, it checks again 30 seconds later and only alerts if it’s still silent.

Will I hear about it when I’m away from the screen?

Yes. Telegram notifications can be switched on per object: you get a message when an alert starts and when it clears. The Events log records every change either way.

What if there’s no built-in check for what I need?

That’s what custom checks are for: Track runs your own stored procedure, compares the number it returns with a threshold and alerts just like any built-in type.

  • Core

    Script Automation

    Loads, converts and syncs files, transfers over FTP and cleans up.

  • Core

    Report Reporting

    Regulatory and royalty reports, affidavits and statistics from your own as-run log.

An illuminated on-air lamp on the studio wall

Contact

Let’s listen to your station together.

Show us how you work today. We’ll show you how much time you can move from routine chores to content and quality.